Home List your patent My account Help Support us
Envisioning Financial Information - Method of displaying data
[Category : - DESIGN PATENTS]
[Viewed 2007 times]
We have a short video showing the graph at Link
Patent Abstract:
Data is reduced to a graphic representation by have a core value which is wrapped by an annulus of a related value, the thickness of the annulus and the base diameter of the core representative of the magnitudes of the data being represented. A third data family can be represented by depiction being selected from a group consisting of a segment of said first core circle, a segment of said first annulus, and a second independent annulus concentric with said first annulus depending on whether said third variable is a) more closely related to said first variable, b) more closely related to said second variable, or c) is an independent, stand alone variable, respectively. A sequence of graphic depictions representing pie charts at successive time periods can be interconnected and smoothed to form a 3-D surface of revolution.
 Patent publications:
 US 6927772
Asking price:
Make an offer
Make an offer
 Great invention
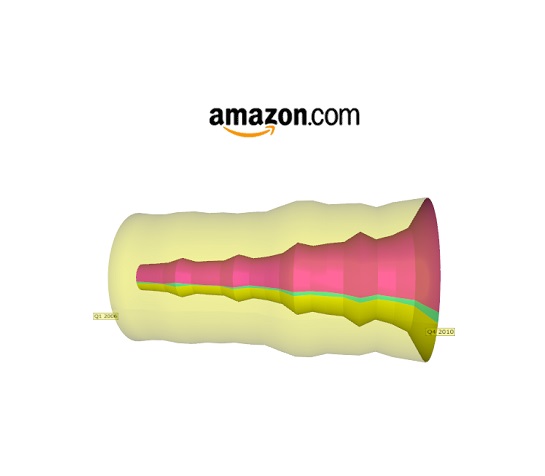
[ Home | List a patent | Manage your account | F.A.Q.|Terms of use | Contact us]
Copyright PatentAuction.com 2004-2017
Page created at 2025-11-07 4:12:25, Patent Auction Time.